

Three years ago, I discovered Playwright Trace Viewer while helping our team debug a complex audio processing application. What started as curiosity became a game-changer that now saves us hours every week.
We had this complex flow where users could upload audio files, apply effects, and export them. Screenshots were our go-to debugging tool, until they weren't.
One day, a test kept failing in CI. The screenshot showed everything looked perfect. The upload button was there, the file was selected, but the processing never started.
Then, I opened the trace file.
The timeline revealed what screenshots couldn't: the upload started, hung for 8 seconds (invisible in screenshots), then silently failed with a 413 error in the network tab. The audio file was too large for our nginx config.
.webp)
{{blog-cta-1}}
Playwright Trace Viewer: Your New Debugging Superpower
The moment I shared this with my team, everyone wanted in. We'd been debugging blind, and suddenly we had X-ray vision in our tests.
1. Cut debugging time from hours to minutes
Here's what changed for us: A flaky test that used to take hours to diagnose now takes a few minutes. Recently, a junior dev fixed their first CI failure without asking for help, just downloaded the trace, found a timeout in an API call, and pushed the fix.
The numbers back this up. Teams using Trace Viewer report finding root causes drastically faster than traditional debugging. One QA lead mentioned their team cut debugging time by 80% after adopting traces.
2. Why Playwright's approach stands out
Traditional tools give you breadcrumbs. Selenium might throw "Element not found." Cypress shows a video. But Playwright? It gives you the whole crime scene.
You get DOM snapshots you can inspect like a paused browser. Network requests with full details. Console logs tied to exact moments. It's not just recording what happened; it's preserving the entire browser state at each step.
While Trace Viewer revolutionized our debugging, modern testing demands more. That's why we're building Testdino at Alphabin, unifying test observability, intelligent reporting, and AI-powered generation in one platform. Learn how we're solving testing's biggest challenges.
{{cta-image}}
Playwright Trace Viewer 101
Let me break down what happens when you enable tracing.
1. What's inside a trace file
A trace.zip contains everything: every click, every network call, every DOM change. It's like a black box recorder for your tests.
When I first opened one, I was surprised it included:
- Screenshots before AND after each action
- Full DOM snapshots (not just images, but HTML you can inspect)
- Every console.log, warning, and error
- Network waterfall with timings
- The exact test code that ran
One trace from our audio app was 47MB. Heavy? Yes. Worth it? Absolutely.
2. Accessing traces: CLI, Web, and Remote
Three ways to open traces, depending on your workflow:
1. Local CLI: Perfect for debugging on your machine. Opens instantly.
2. Web viewer: Drag and drop your trace file. No installation needed. I use this when helping teammates, just share the .zip file.
3. CI artifacts: Download from your pipeline GitHub Actions, Jenkins, wherever, grab the trace and debug locally.
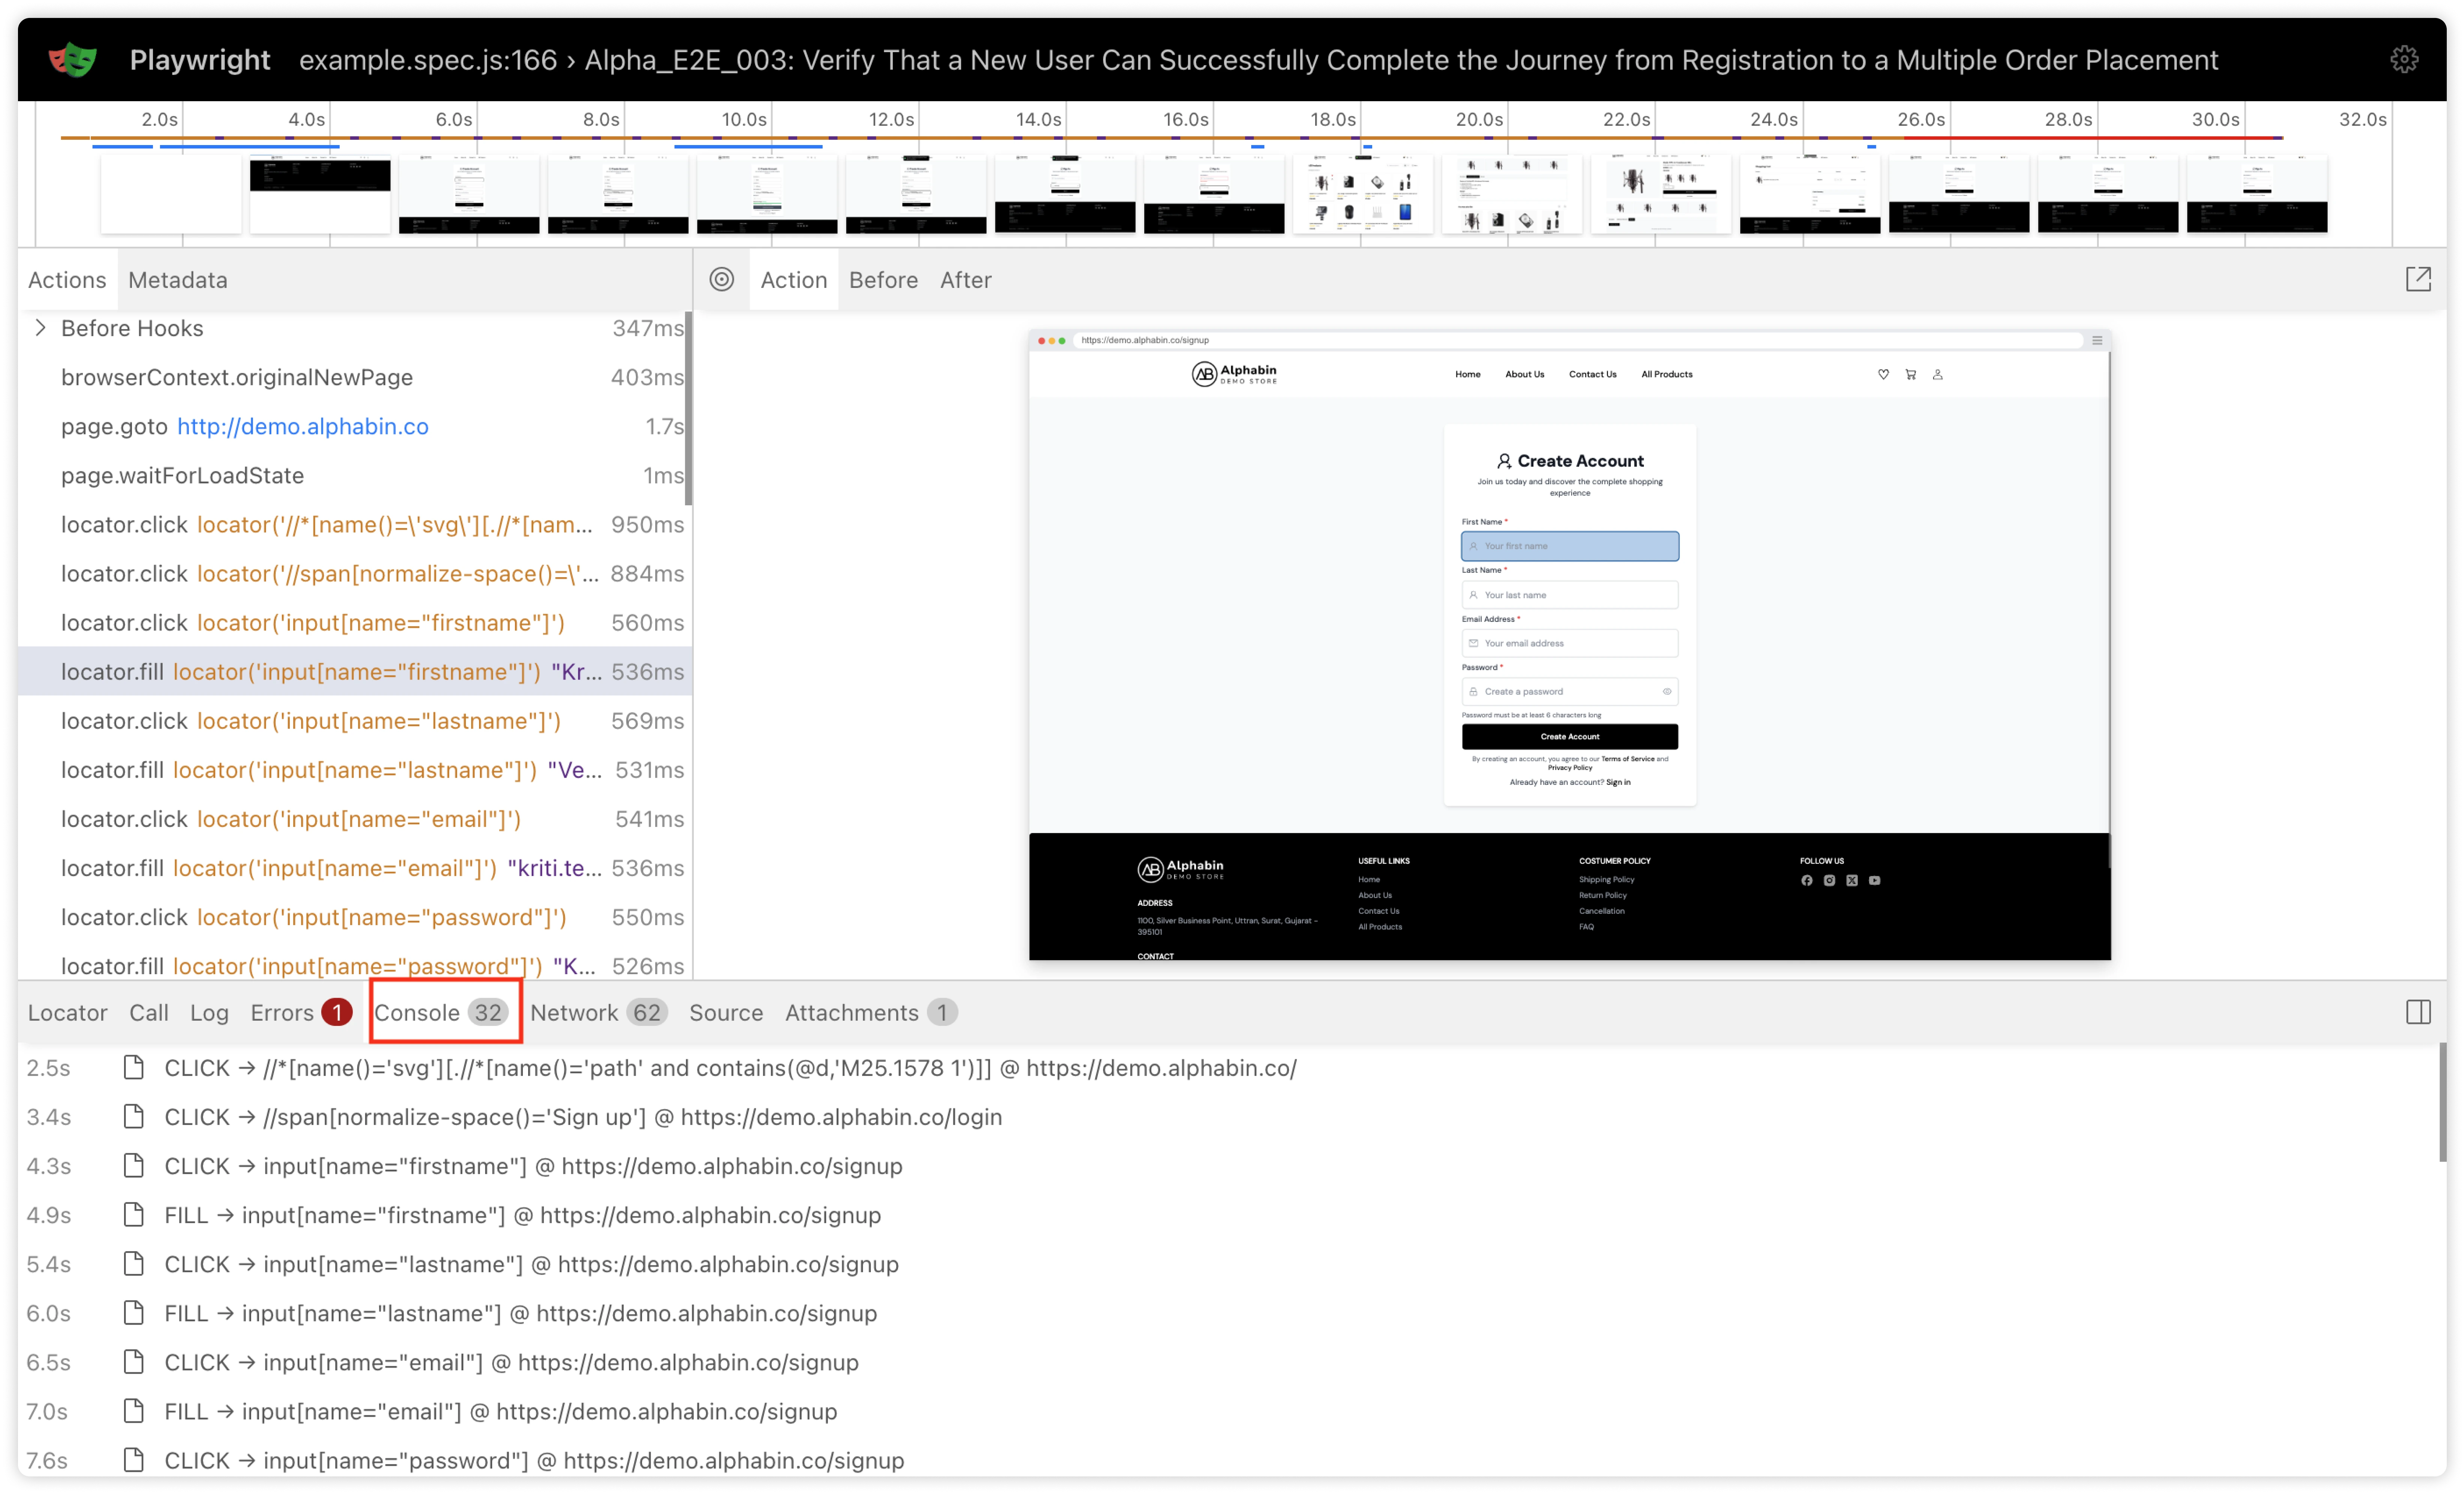
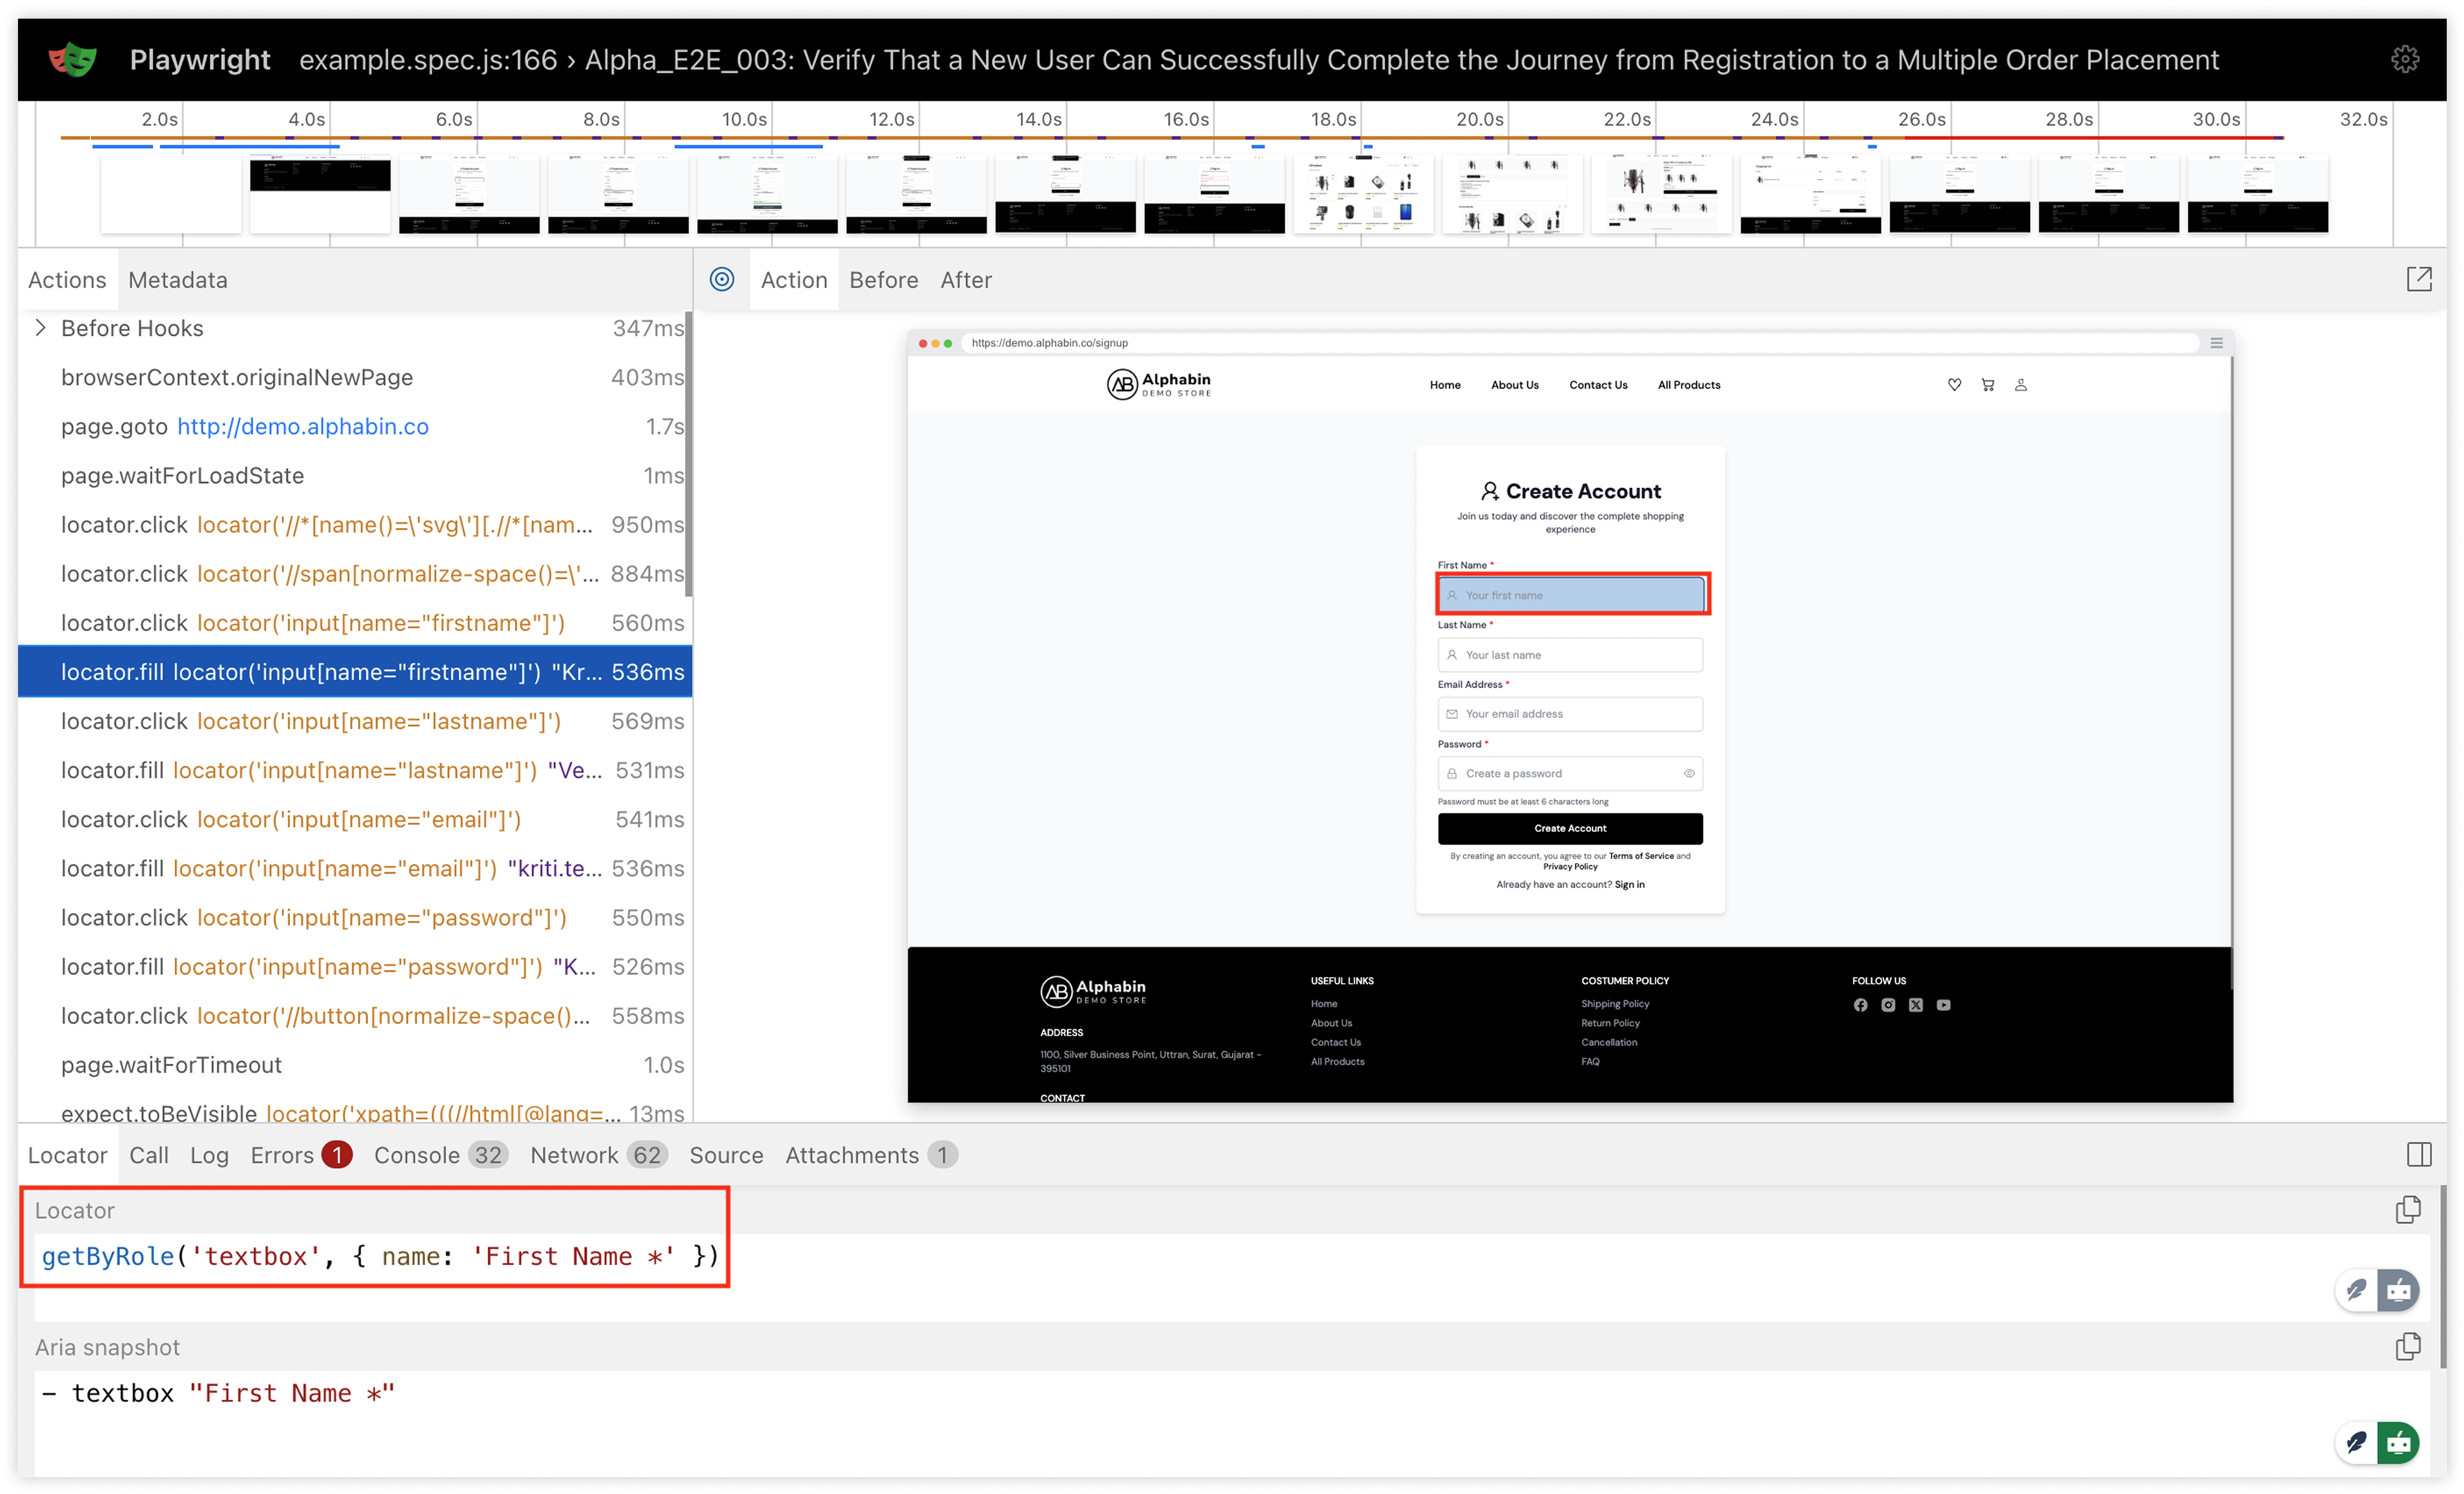
3. Key components: Timeline, Actions, DOM, Network, Console
The interface splits into panels that tell your test's story:
- The Timeline shows every action as a bar. Long bar? That action was slow. Red marker? That's where it failed.
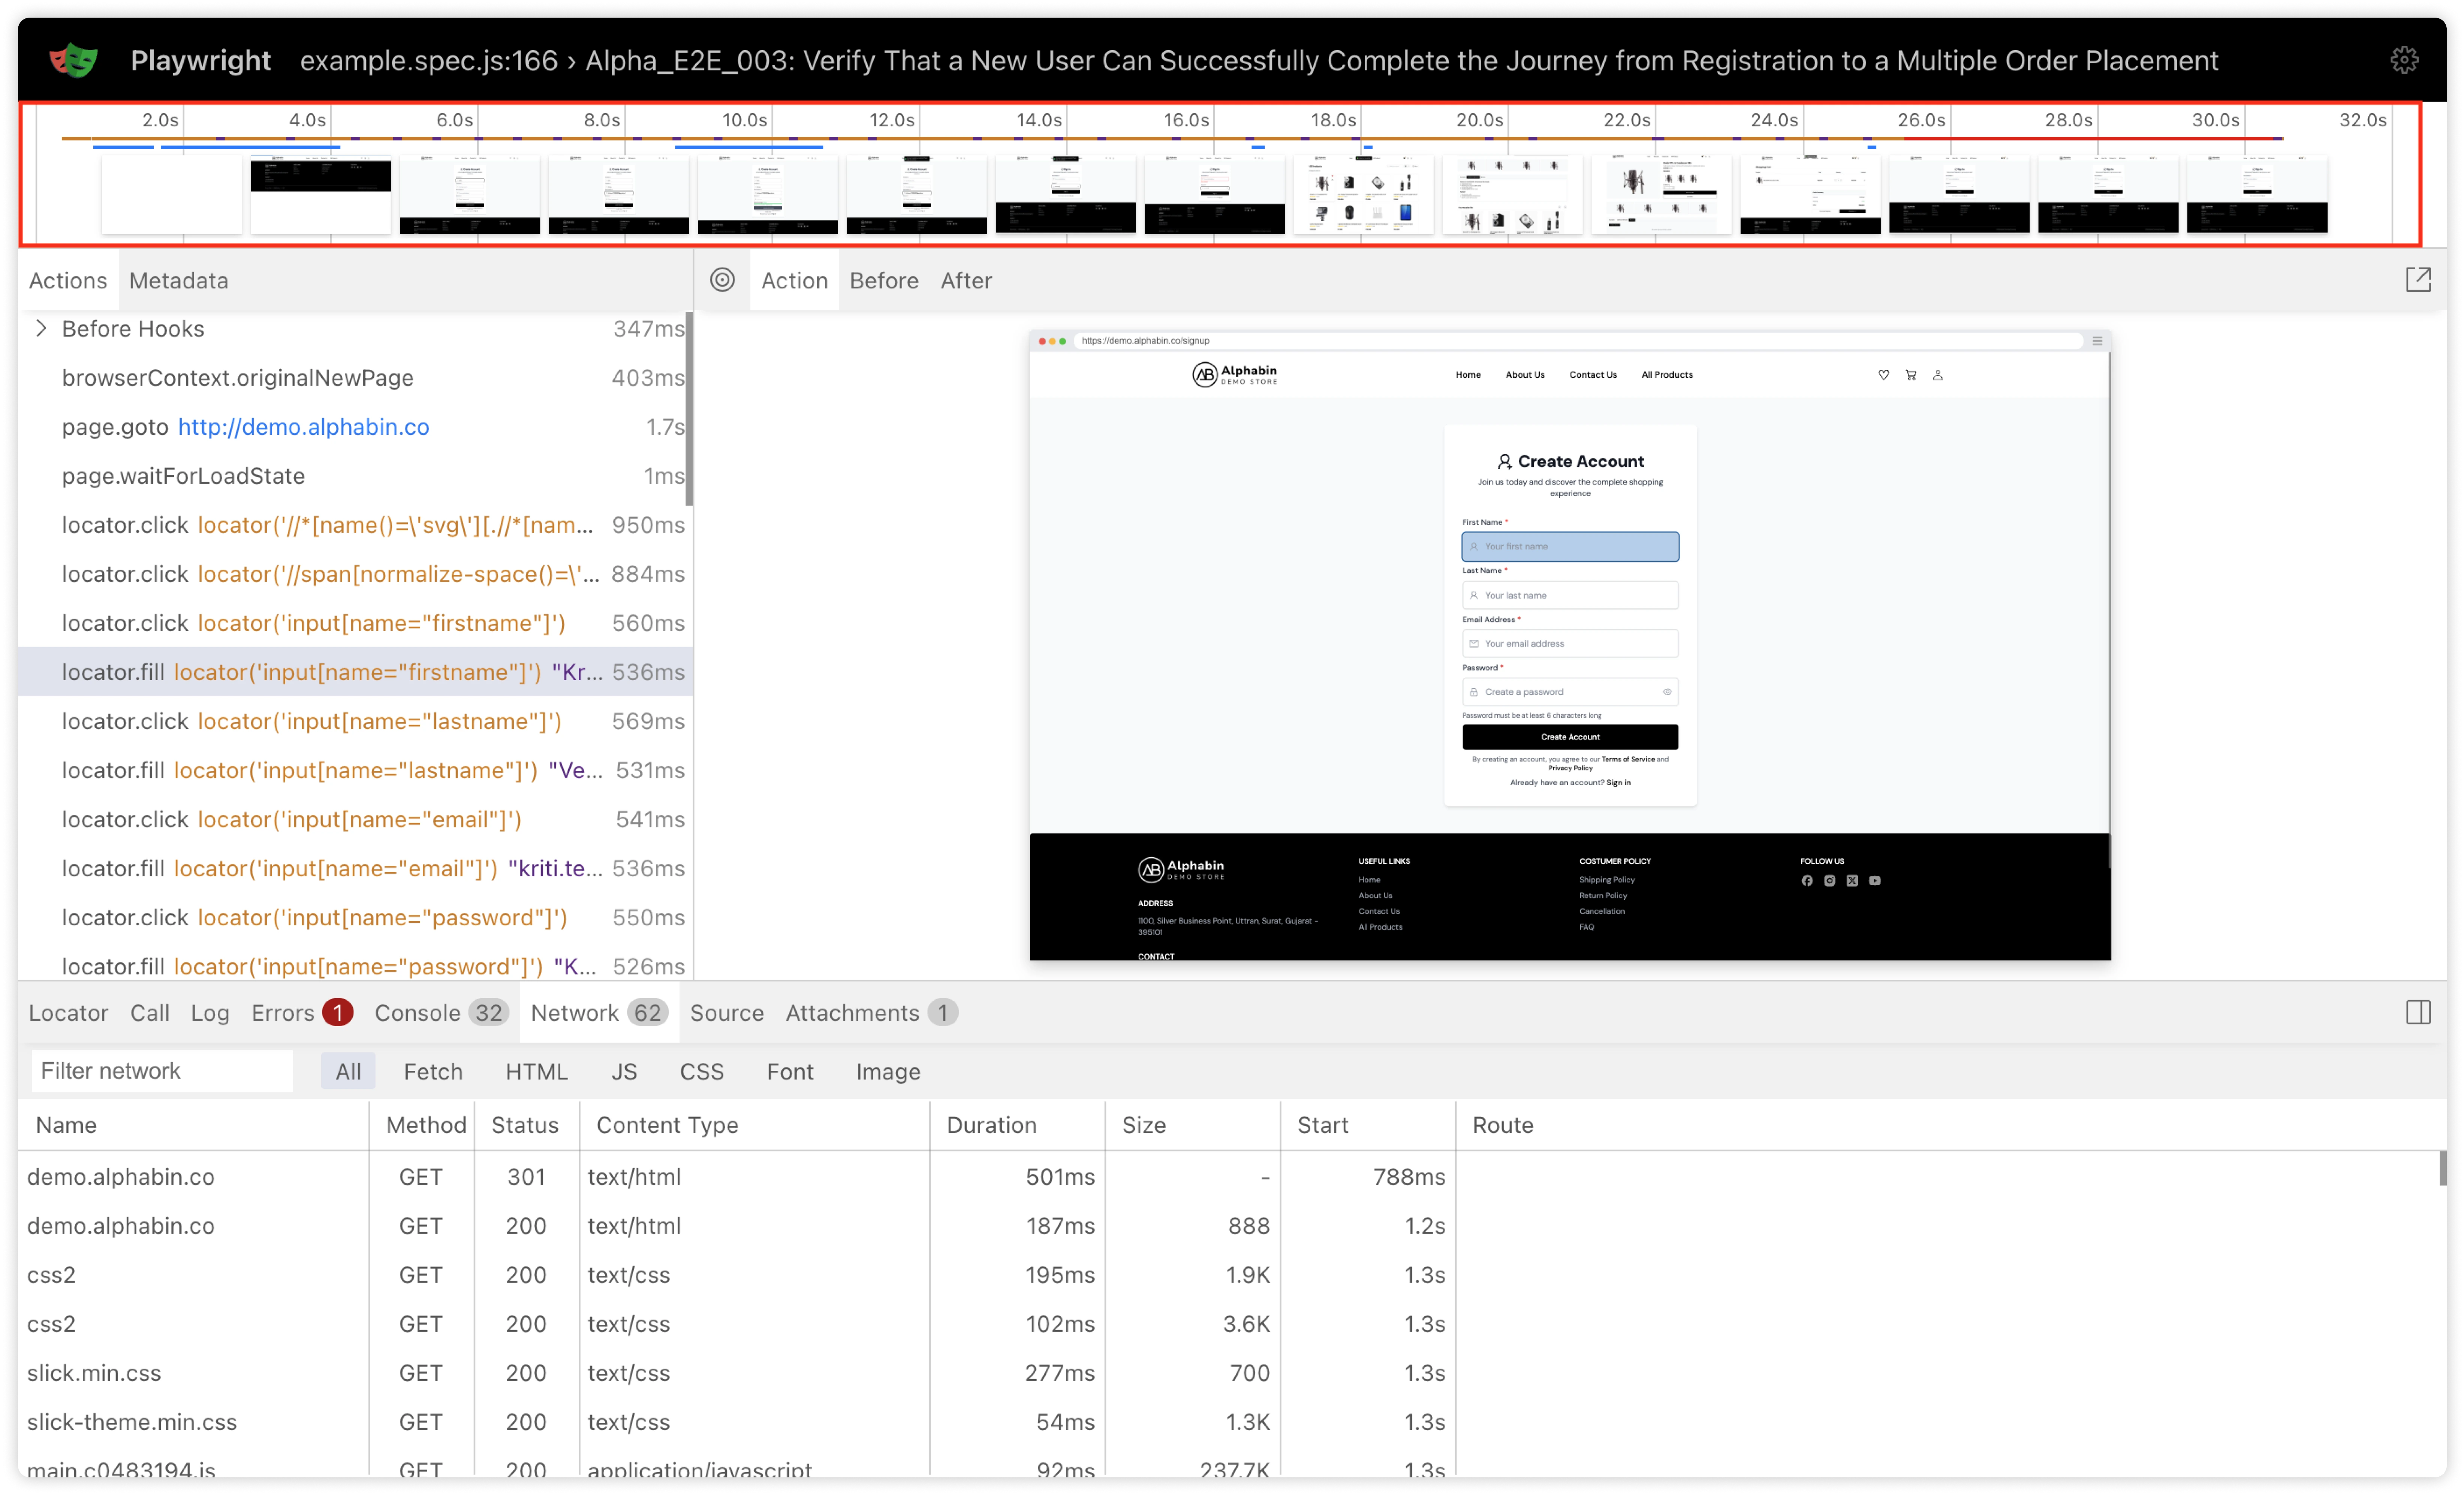
- The Actions Panel lists what your test did, clicks, assertions, and navigations. Failed steps glow red. No more guessing where things went wrong.
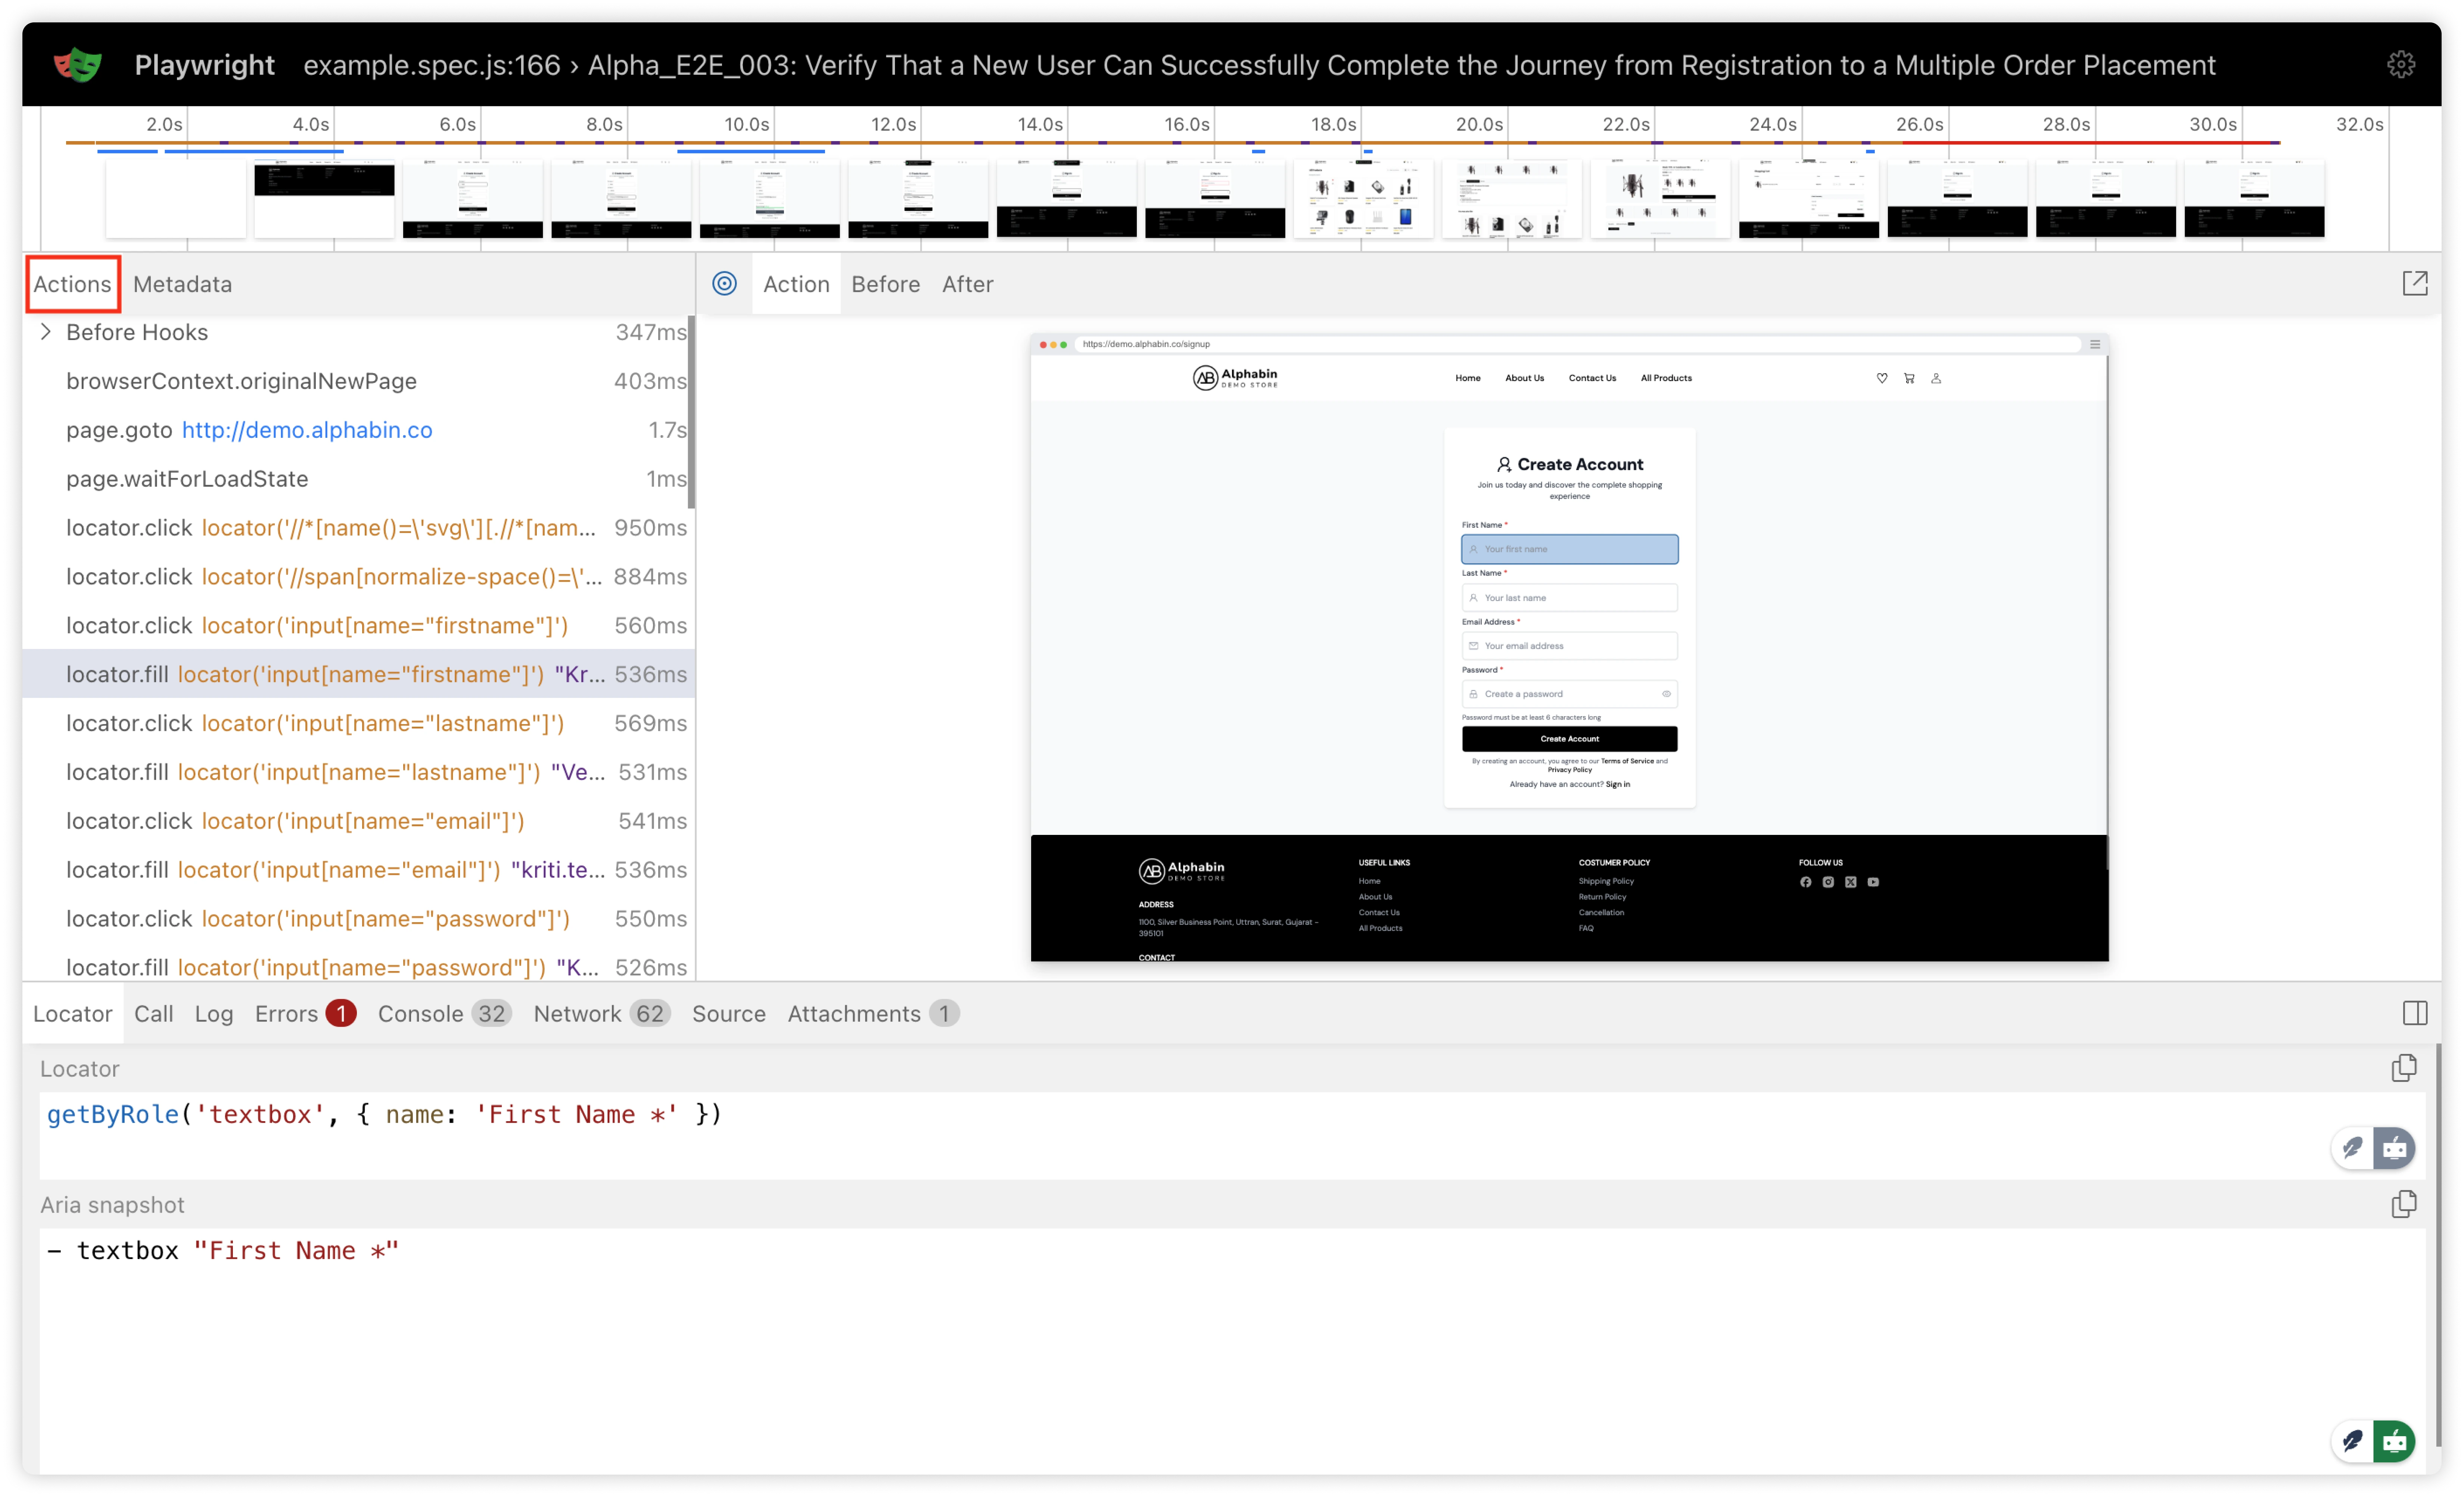
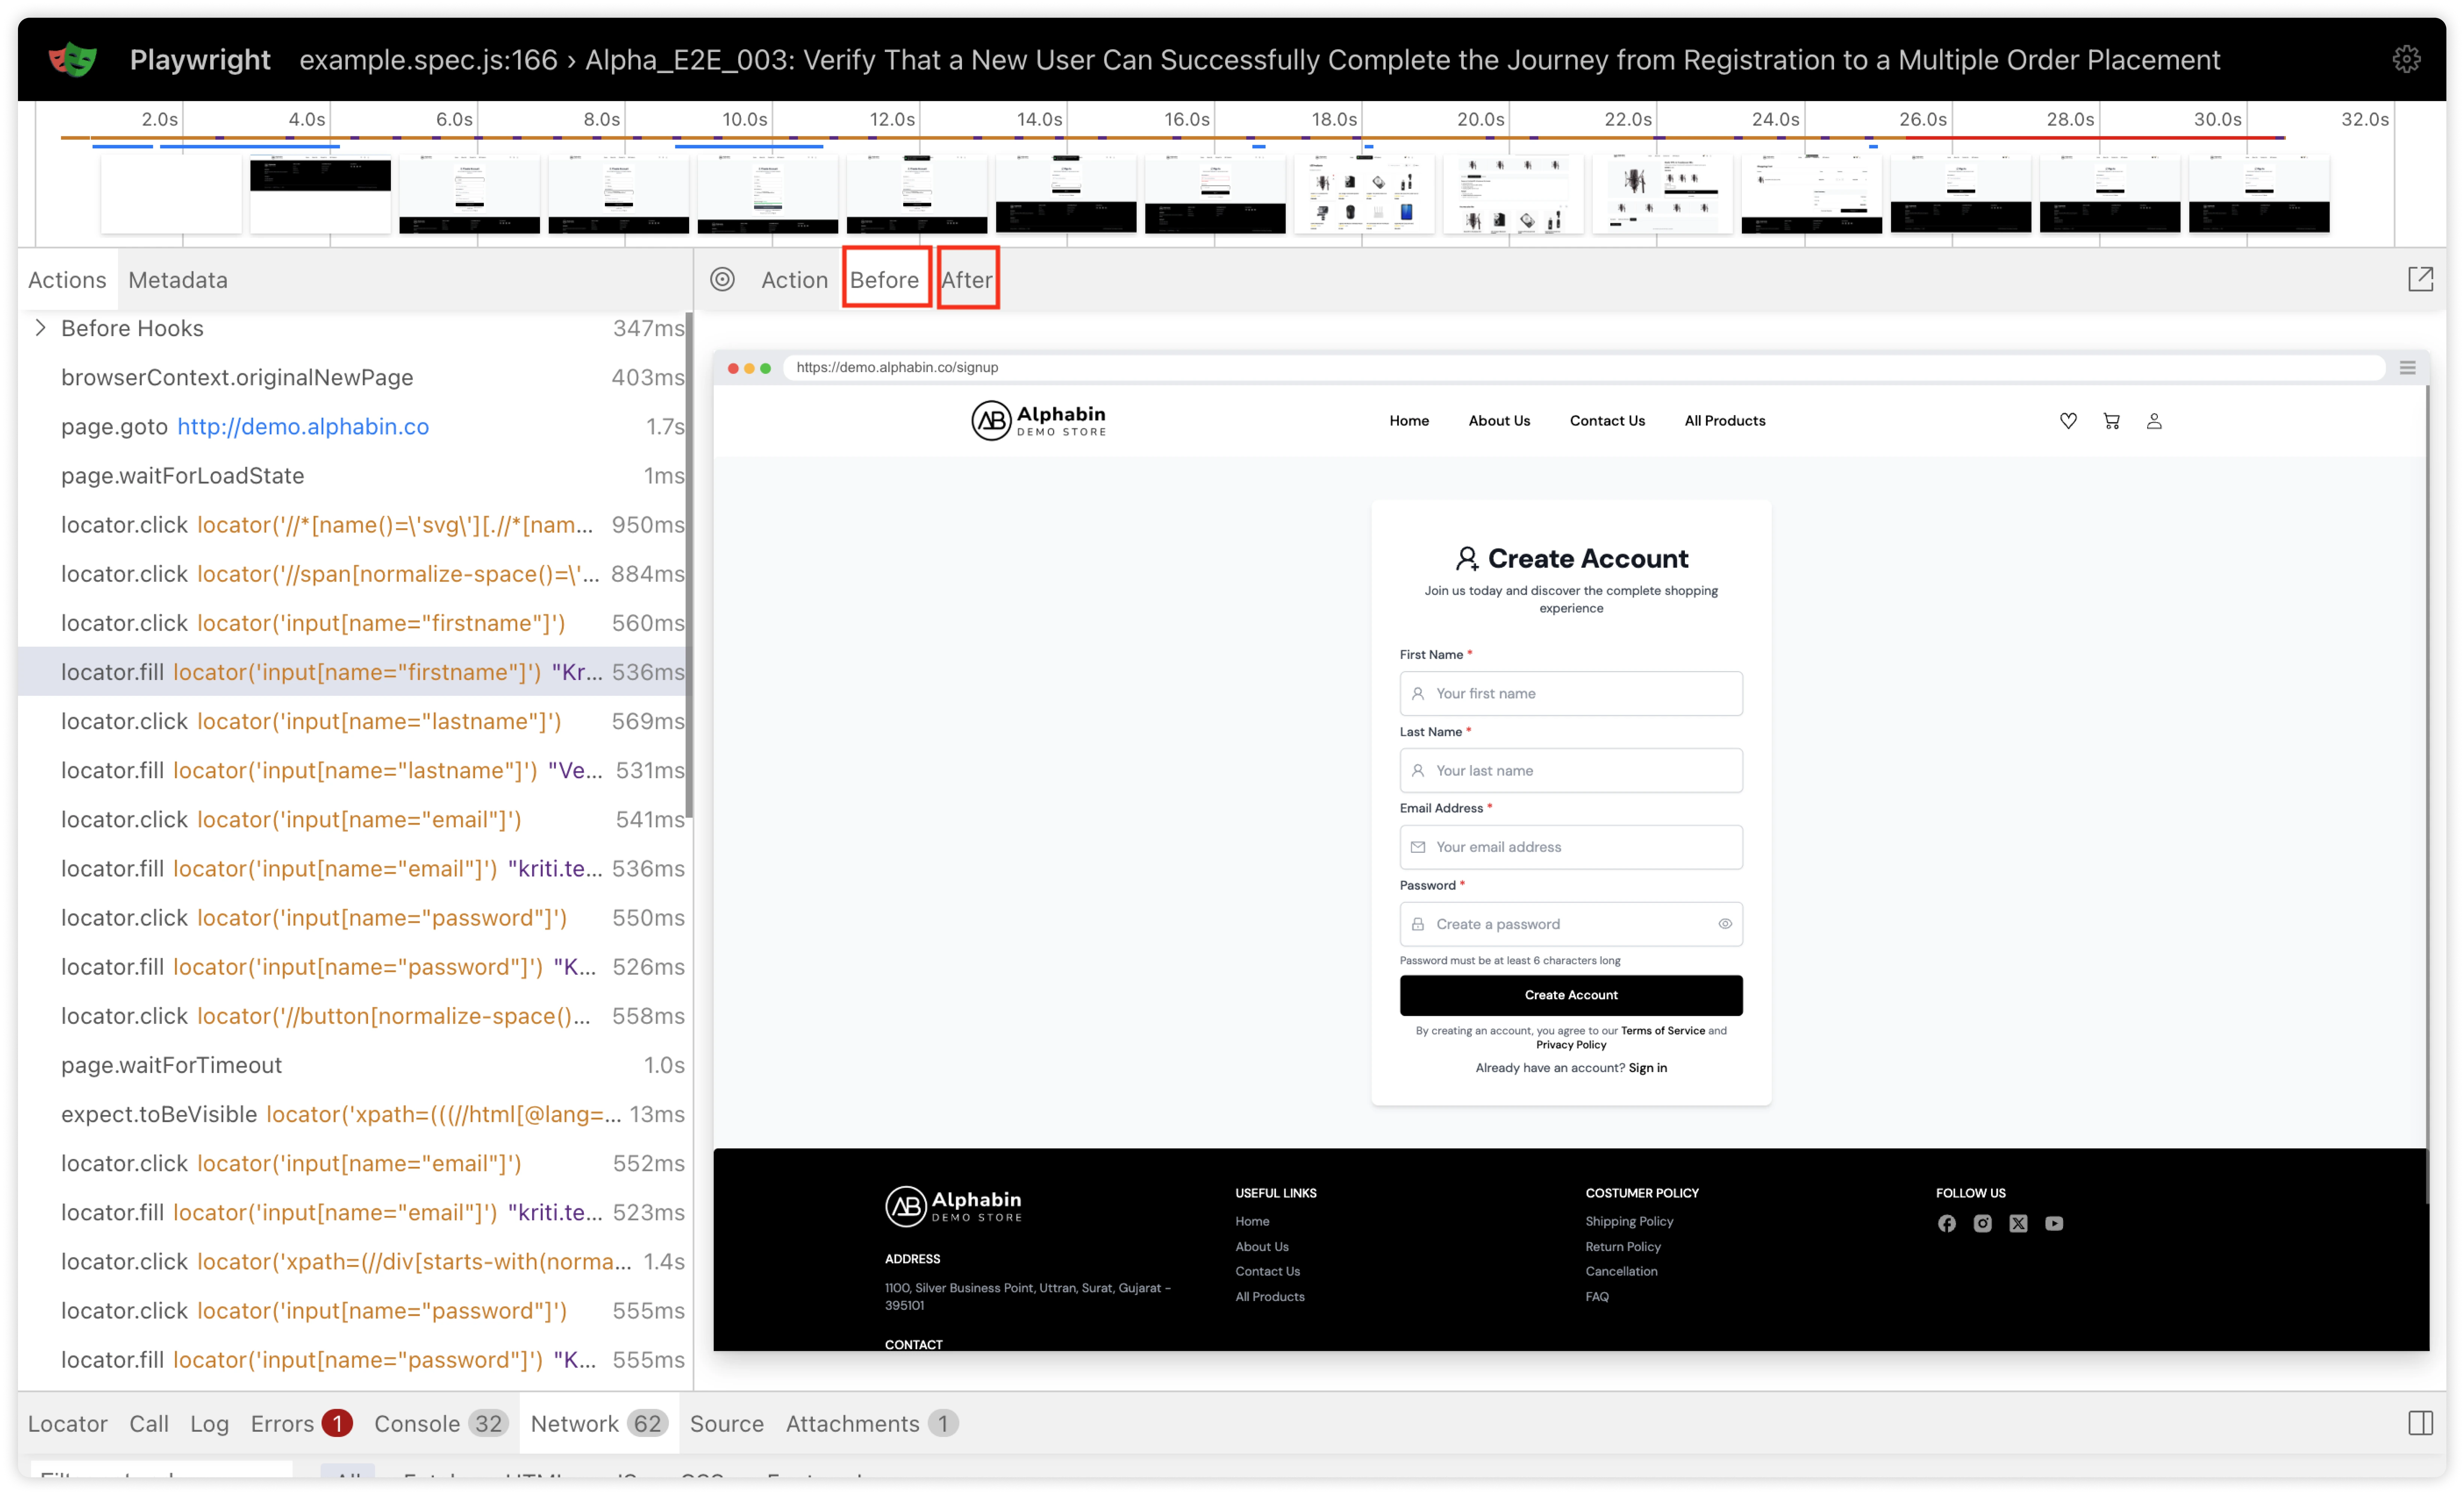
- DOM Snapshots are the game-changer. Click any action, and toggle between "Before" and "After" states. It's like having a time machine for your browser.
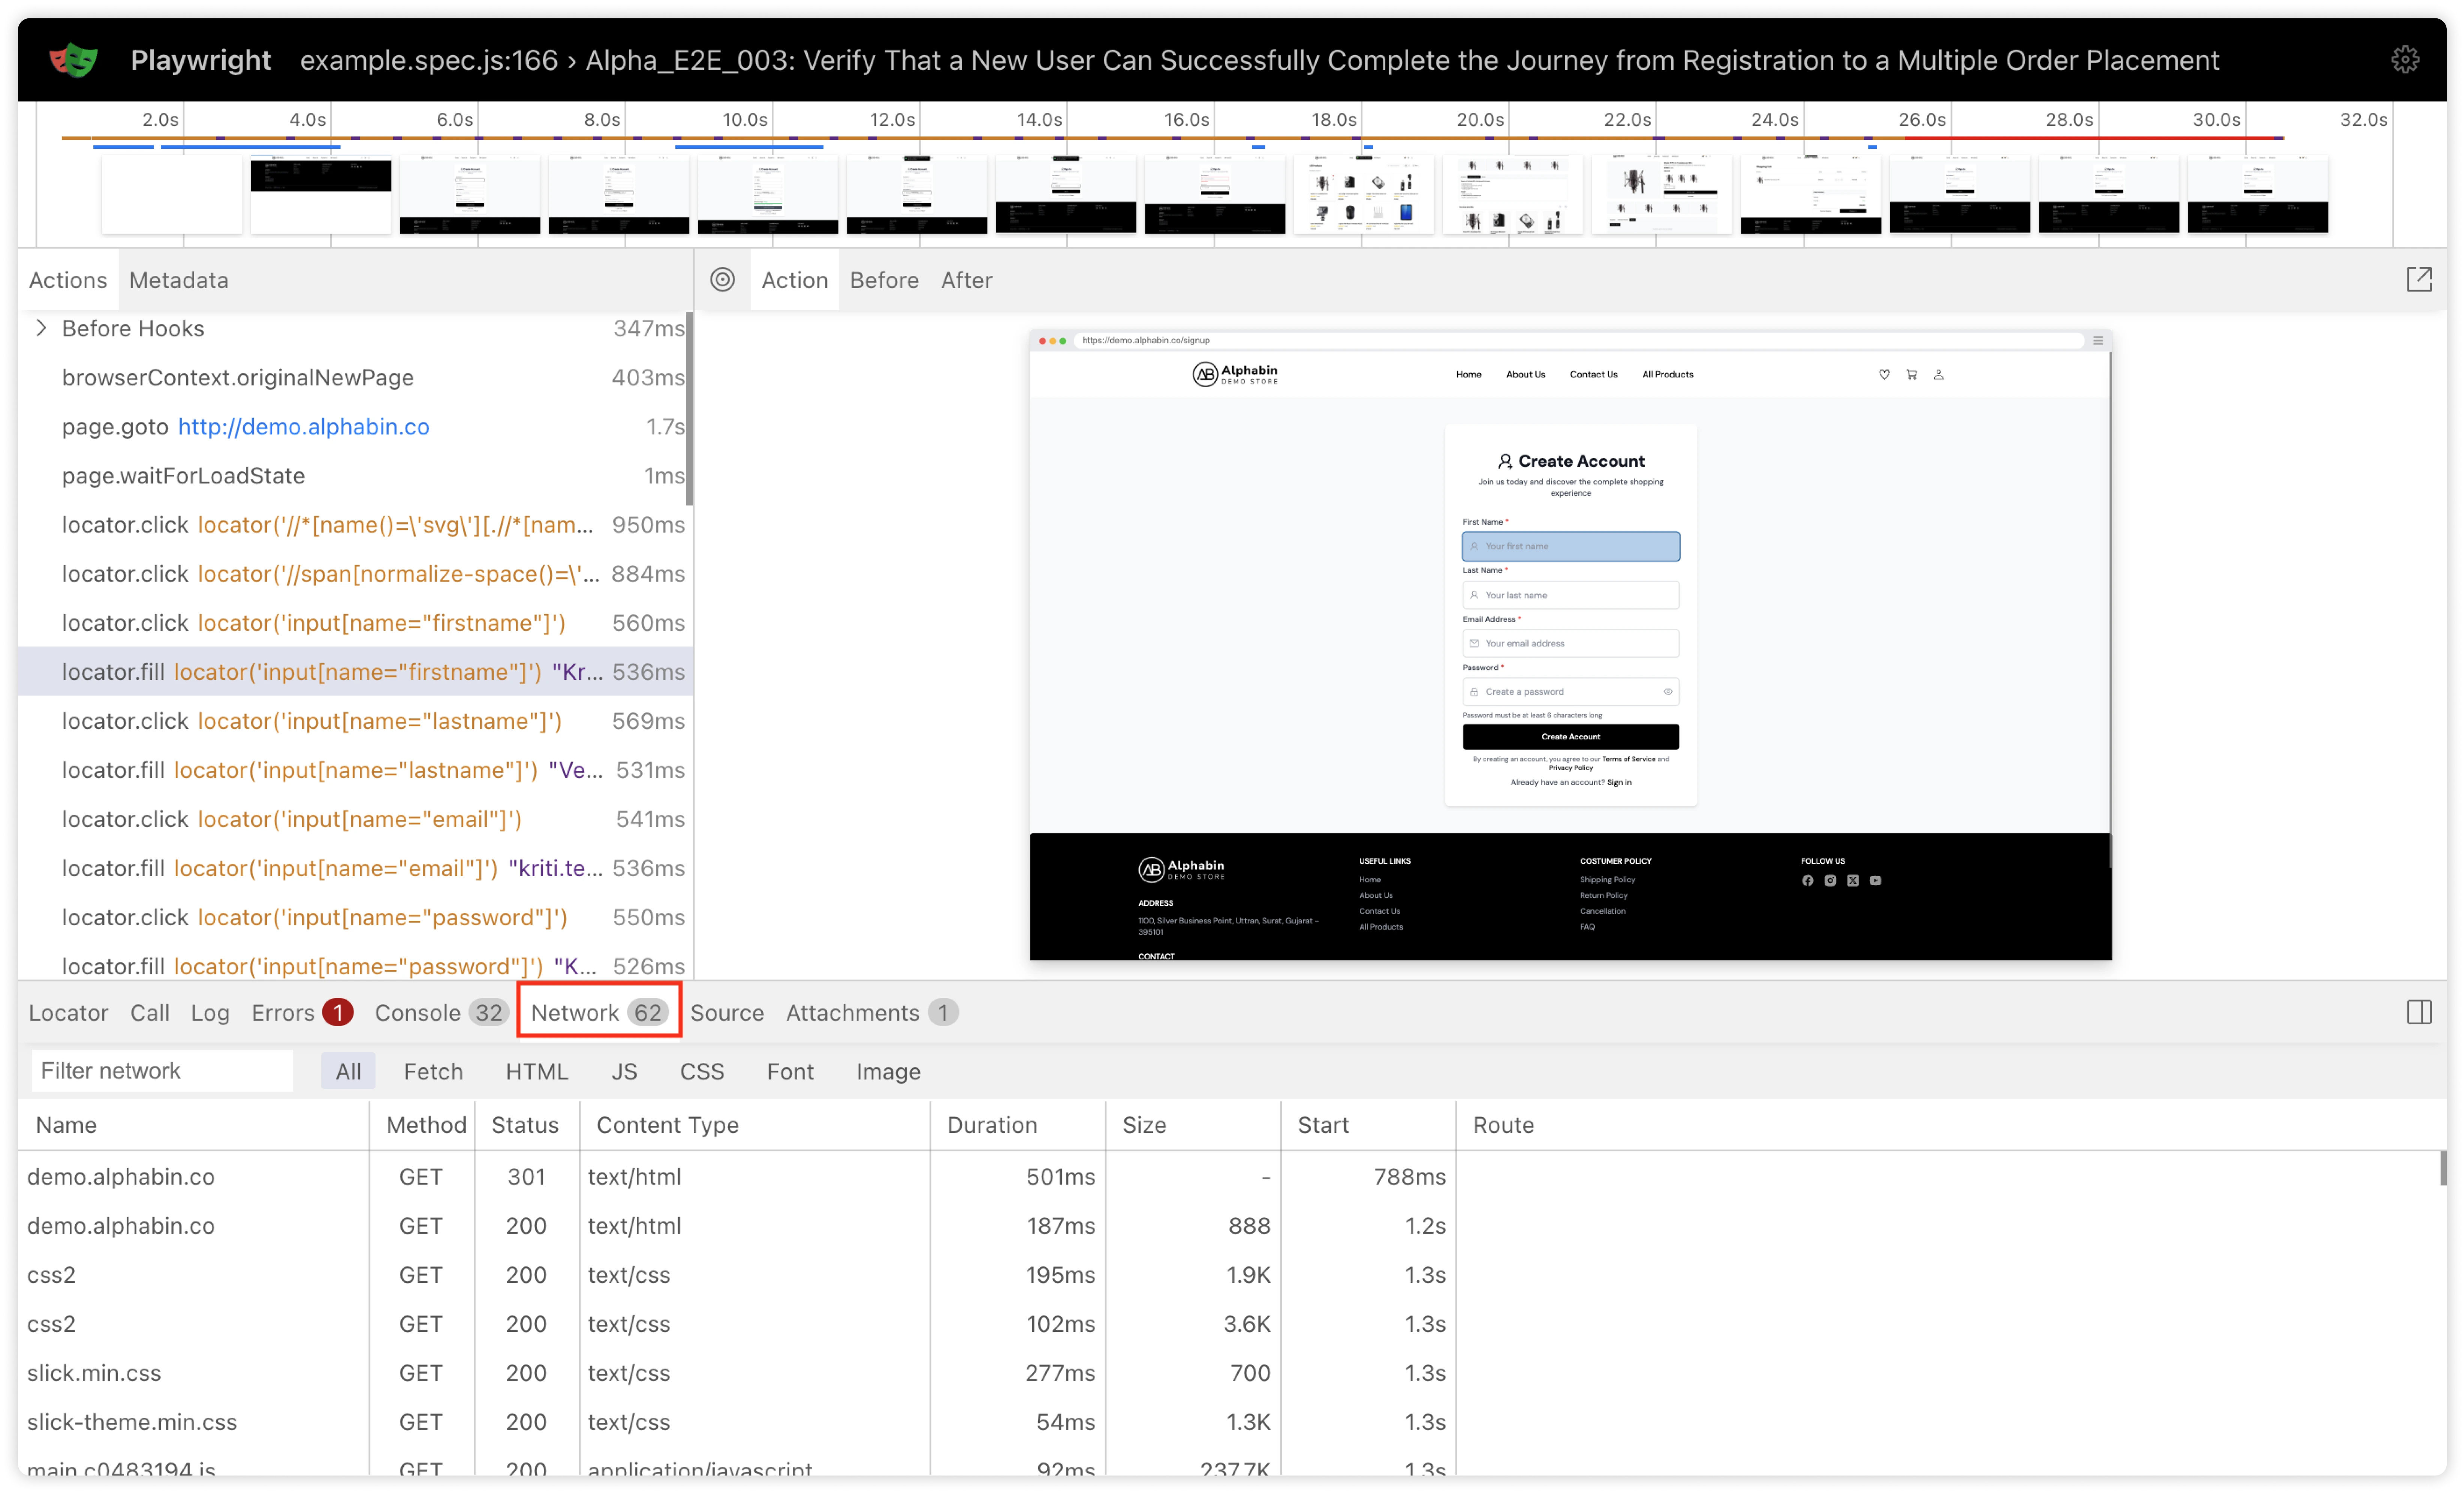
- The Network Tab caught that 413 error in my audio app. Every request, response code, timing, it's all there.
- Console Logs show JavaScript errors that might not fail your test but explain weird behaviour. That "undefined is not a function"? Now you'll see it.
Getting Started with Playwright Trace Viewer
1. Configuring for different environments
Your playwright.config.ts needs one line:
Other options:
- 'on' - Records everything (slows tests, huge files)
- 'retain-on-failure' - Keeps only failed traces
- 'off' - No tracing
2. CI/CD golden rule: trace: 'on-first-retry'
This setting is brilliant. First run: no tracing overhead. Test fails? Playwright automatically retries WITH tracing enabled.
You get traces only when needed. Your CI stays fast, storage stays manageable.
3. Smart file naming
By default, Playwright names traces sensibly: test-name-chromium-retry1.zip.
But you can get creative. We add build numbers:
Makes finding specific traces much easier when debugging historical failures.
{{blog-cta-3}}
Advanced Debugging Techniques
After months of using Playwright Trace Viewer, I've developed some power moves.
1. Tackling flaky tests with trace comparison
Flaky test driving you crazy? Here's my approach:
- Run until it fails, save trace
- Run until it passes, save trace
- Open both side-by-side
I compare the action sequence, network timing, and console output. Usually, the difference jumps out, maybe an API responded 50ms slower, causing a race condition.
2. Multi-browser debugging tricks
WebKit trace showed our audio waveform renderer positioned 10px off. The Firefox trace? Perfect. Chrome trace? Also perfect.
Comparing traces across browsers immediately revealed CSS calc() differences. It would've taken hours of manual testing to find that.
3. Debugging authentication flows
Long setup killing your trace size? Use chunks:
Now you have focused traces. Login fails? Check login-trace.zip. Test fails? Check test-trace.zip.
4. API mocks and network troubleshooting
We mock external APIs in tests. Playwright Trace Viewer shows whether mock's activated:
Network tab confirms: "Fulfilled by route" instead of the actual network call. No more "did my mock work?" guessing.
5. Pinpointing performance bottlenecks
Test timing out? Check the timeline. We found our audio spectrum analyzer taking 12 seconds on CI (vs 2 seconds locally).
The trace showed why: CI machines had 1 CPU core, triggering a single-threaded fallback in our WebAssembly module.
This is just the beginning. At Alphabin, we're taking it further with Testdino, imagine Trace Viewer's insights combined with automated test generation and intelligent failure analysis, all in one unified platform.
{{cta-image-second}}
CI/CD & Remote Debugging
1. GitHub Actions + trace artifacts
Our workflow:
Failed test? Download artifacts, open trace, fix issue. No more "works on my machine."
.webp)
2. Viewing traces from CI failures
Pro tip: We added a bot that comments on PRs with failed tests:
"Test failed: audio-upload.spec.ts
Download trace | View in browser"
Developers can debug without even cloning the branch.
3. Sharing traces with your team
Trace files are self-contained. Slack them, attach to tickets, and drop in shared drives.
We keep a "Hall of Fame" folder of interesting failures. New team members review these to learn common pitfalls.
Troubleshooting Common Issues
1. Element not found
Trace shows the element wasn't in DOM? Check the Before snapshot; maybe the previous navigation failed.
Element exists, but test can't find it? Inspect the snapshot's HTML.
The locator helper (hover over the element in snapshot) is essential. Shows the exact selector Playwright would use.
2. Timeout and race conditions
See a 30-second bar in the timeline? That's your timeout.
But why did it timeout? Check:
- Network tab: API calls pending?
- Console: JavaScript errors?
- Snapshots: Element never appeared?
Our audio preview had a race: sometimes the waveform rendered before the play button initialised. Trace timeline showed the 50ms gap causing failures.
3. Cross-browser issues
WebKit traces revealed our audio player used -webkit-appearance styles, Firefox ignored. Different browsers, different behaviours; traces make these visible.
4. Async and dynamic content bugs
Modern apps are async nightmares. Traces help by showing exactly when things happen.
Our bug: Upload progress bar reached 100%, but success message took 2-8 seconds to appear (backend processing). Tests checking immediately after upload failed randomly.
Solution found via traces: Wait for specific network call completion, not UI updates.
Pro Tips & Best Practices
1. Code vs. config tracing
Config for failures, code for surgery:
2. Shrink trace size
Big traces? Try:
- Split long tests
- Use chunks for different sections
- Disable screenshots for data-heavy operations
Our file upload tests generated 200MB traces. Now we disable tracing during actual upload, and re-enable it after.
3. Debug-friendly test design
Write tests that produce clear traces:
Future you will thank present you.
4. Team workflows + IDE integration
VS Code + Playwright extension = debugging heaven. Test fails? Click trace link in test results. Opens immediately.
We pair-debug using traces. Senior dev shares screen, walks through trace: "See here? The API returned 401. Check your auth token."
Better than any documentation.
Conclusion: Next Steps
Quick-start checklist
- Trace: 'on-first-retry' in playwright.config.ts
- Configure CI to upload trace artifacts
- Run one test with-- trace on to practice
- Show your team a trace walkthrough
Pitfalls to avoid
- Don't enable traces for all tests (kills performance)
- Don't ignore traces when tests fail ("maybe it'll pass next time")
- Don't share traces with sensitive data publicly
- Don't trust AI fixes blindly
- Don't forget to update Playwright regularly
Resources for continued learning
Start with Playwright's docs on debugging. Watch their YouTube demos.
The r/QualityAssurance subreddit has great Playwright discussions. Stack Overflow for specific issues.
Trace Viewer's role in your testing strategy
Playwright Trace Viewer transformed how we approach testing. Failures aren't mysteries anymore; they're puzzles with all pieces visible.
For SaaS/FinTech teams running complex flows, traces are non-negotiable. They turn your test suite from a black box into a glass box.
Modern QA isn't about finding bugs; it's about understanding them quickly. Playwright Trace Viewer gives you that understanding.
Next time a test fails, don't rerun it hoping for green. Download the trace. Open it. The answer is usually right there, waiting for you to see it.


.svg)


.webp)


.svg)