

In today’s fast-paced world of development, delivering quality software is more important than ever. Playwright is a powerful open-source testing framework created by Microsoft to test users interacting with web browsers and it's the key to many developers' and QA teams' end-to-end web application testing success.
But here’s the catch: running tests in Playwright is only one step in the process. What truly matters is what you do with the output of those tests. Understanding how to analyze, interpret, and act on your test results can dramatically improve your testing strategy.
This is where a Playwright test report becomes essential and where tools like TestDino can enhance the experience by transforming raw Playwright output into meaningful insights, trends, and actionable analytics.
A Playwright test report doesn’t just show which tests passed or failed; it provides critical insights such as test duration, flaky behavior, skipped tests, and detailed evidence of failures.
When paired with reporting and analytics platforms like TestDino, these results can be elevated into a comprehensive dashboard that helps teams identify patterns, classify failures intelligently, and monitor the health of their test suite over time.
In this blog, we’re going to outline why Playwright test reports are invaluable for improving efficiency in your testing process and how leveraging advanced reporting tools like TestDino can help you make more informed decisions, strengthen your QA pipeline, and ultimately improve your development workflow.
.png)
Benefits of Using Playwright Test Reports:
1. Faster Debugging: Detailed traces and reports provide quick analysis and solution to bugs.
2. Improved Collaboration: Sharing test reports with teammates encourages transparency and collaboration.
3. Data-Driven Decisions: Test results provides significant insights for problem-solving approaches, product development, and testing methods.
4. Better Test Management: By visualizing results and analyzing progress, you can quickly manage your test suite and ensure full coverage.
Why are Playwright Test Reports important for QA?
- Test Coverage Visibility: Reports show which features and functions are being tested and which need more attention.
- Initial Problem Detection: Reports set up correctly detect issues early in the development cycle when it’s cheaper to fix.
- Faster Debugging: When an issue occurs, Playwright test reports give full logs and trace information to help developers find and fix bugs.
- Historical Performance Tracking: Reports build up an overview of application quality over time so you can see patterns and frequent issues.
Understanding Playwright’s Test Report
Playwright has multiple built-in reporters, each for a specific use case. These include list, line, dot, HTML, JSON, and JUnit reports. Each has different levels of detail and formats to suit your needs.
Test reporting is built right into Playwright to enhance your understanding of your test results. By simply running your tests with npx playwright test, Playwright will automatically collect the results and offer you a constituency of reports.
When you run your tests, Playwright saves results to a folder ("playwright-report/) Then you can report the results in several different ways.
Better Playwright test coverage means your tests are comprehensive, trustworthy and find issues sooner -- so that your app works perfectly every time.
Key Elements of a Playwright Test Report.
Test Cases
Each report includes details for a specific test case:
- Test name and description
- File location, tags and annotations
- Test steps
- Status
Pass/Fail Metrics
Pass/fail metrics are a high-level overview of test health, and are one of the most important parts of the playwright test report
- Total tests run
- Tests passed
- Tests failed
- Tests skipped
Time Metrics
Teams can identify issues with execution by using time data from the playwright test report.
- Total time
- Test time
- Slowest tests
- Historical timing comparisons
Error Records
Detailed error information is key to troubleshooting when tests fail:
- Stack traces and error messages
- Screenshots taken at failure locations
- Video recordings
- Console logs
- Network logs
Built-in Playwright Reports
Playwright has built-in reporting for tests to better understand results. Each time you run tests with npx playwright test, Playwright will collect the results and can generate multiple reports.
The List, Line, and Dot reporters will provide different formats of viewing test execution logs in Playwright. These reporters will display results in real-time while the tests execute, but none will generate separate reports as the HTML reporter will do.
1. List Reporter
The List Reporter provides your test results in one line at a time, very much like you would check things off a list.
- Passed test: shows a green check mark and the test name
- Failed test: shows a red cross and an error message
- Skipped test: shows a dash and the test name
Command Line
Playwright Config
Generated Report Example

2. Line Reporter
The line reporter provides a minimal output: a single line that will be updated as the tests run.
Command Line
Playwright Config
Generated Report Example

3. Dot Reporter
The dot reporter gives a dot for each test: a green dot when it passes, red dot when it fails, and a yellow dot when it is skipped.
Command Line
Playwright Config
Generated Report Example

4. HTML Reporter
The HTML reporter gives a complete report in an interactive HTML file, which includes test information, images if you took any, and trace information.
Command Line
Playwright Config
Generated Report Example

5. JSON Reporter
The JSON reporter will provide any test results in a JSON file for programmatic processing, or incorporation with other tools.
Command Line
Playwright Config
Generated Report Example

6. JUnit Reporter
The JUnit reporter creates XML reports that conform to the JUnit standard for getting reports into CI/CD pipelines or for tools that consume JUnit reports.
Command Line
Playwright Config
Generated Report Example

{{cta-image}}
Third-Party Reporters
Playwright has support for third-party reporters, which can improve presentation and analysis of test results beyond the built-in methods.
Find step by step instructions for the four most popular community reporters below:
1. TestDino: Playwright Reporting & Analytics
TestDino is a Playwright reporting and analytics platform that converts your raw test results into an interactive dashboard. Instead of relying only on console logs or local HTML, your team can view test runs, failures, screenshots, and AI-driven insights in one shared place.
Prerequisites
Before adding TestDino, ensure you have:
- A Playwright test project
- Node.js installed
- A TestDino account
- A project created in TestDino
- A project token
1. Install & check the TestDino CLI
You don’t need to install anything globally. Verify the CLI with:
2. Configure Playwright reporters
Add the reporters below to your playwright.config.js or .ts:
This setup:
- Writes a JSON report to
./playwright-report/report.json - Writes the HTML report and assets into
./playwright-report
The JSON file is what tdpw reads when preparing the upload, and the HTML folder provides screenshots and the full Playwright HTML report when you choose to upload it.
3. Run tests
This generates the ./playwright-report folder.
4. Upload reports locally
--token="your-token"is your project token from the TestDino UI--upload-htmltells the CLI to upload HTML assets along with the JSON report (this flag is optional and only needed if you want to upload screenshots and attachments).
5. Upload reports in CI
In CI, you usually want uploads to run automatically after the tests complete.
Store the TestDino token as a secret (for example, TESTDINO_TOKEN) and reference it in your workflow.
Command:
.github/workflows/playwright-tests.yml
Key points:
- The step runs after
npx playwright test if: always()makes sure the upload still runs even if tests fail--upload-htmltells the CLI to upload HTML assets along with the JSON report (this flag is optional and only needed if you want to upload screenshots and attachments).
You can follow a similar pattern in other CI tools by storing the token as an environment variable and calling the same CLI command.
6. View results in TestDino
Once uploads are in place, open the TestDino web app and go to your project’s Test Runs.
You’ll see your run:
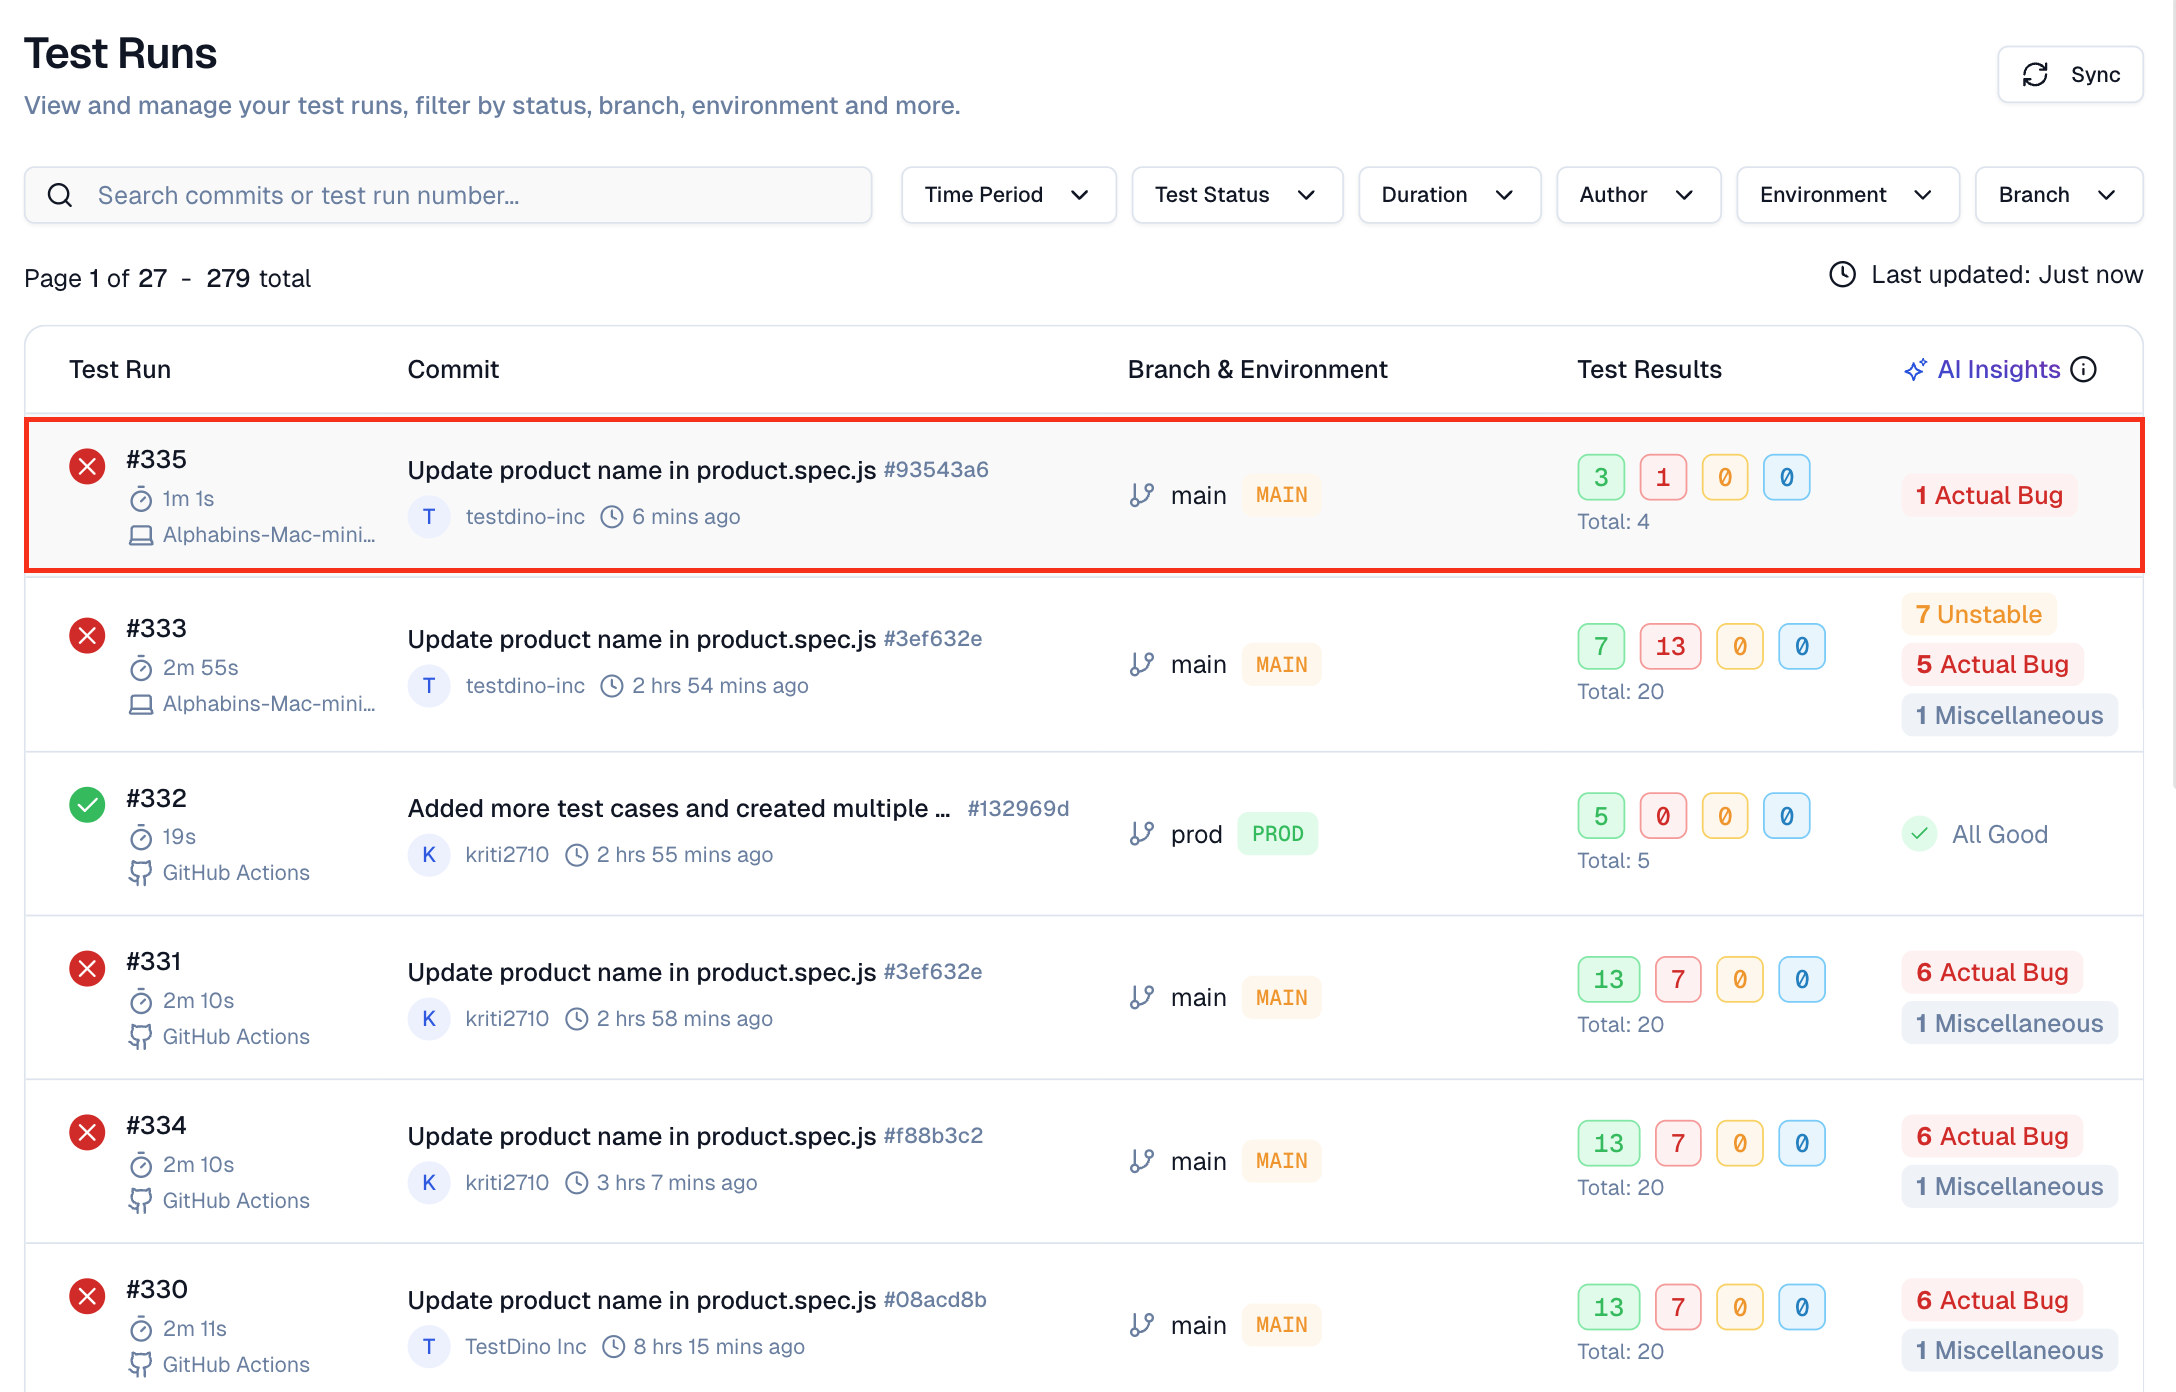
Along with :
- Recent test runs
- Pass/fail counts and durations
- Test details with stack traces and screenshots
- AI hints for debugging and flaky test detection
2. Allure reporter
Allure report is a language-agnostic, open-source reporting engine. It will take raw test-run data from any framework and create a static, interactive HTML site that allows teams to browse through results, trend, and attachments instead of searching console logs.
Allure-playwright turns playwright runs into a self-hosted HTML portal with dashboards, timelines, environment info, and per-step Artifacts.
Installation
To run the tests and enable Allure reporting, use the following command line.
Playwright Config
Command-line Usage
Overview of executed test in allure report

3. Mocha + Mochawesome
Mocha is a well-known JavaScript testing framework, running on Node.js, that is used for unit and integration types of tests.
Mochawesome is a third-party reporter for Mocha that will output test results in a clean, customizable HTML file, providing you with a detailed visual test report.
It enhances the native Mocha reporter with more structure, error reporting and some visual representations of tests such as pie charts and status indicators (passed, failed, skipped).
Installation
To begin using Mocha and Mochawesome in Playwright, you have to install Mocha and the Mochawesome reporter via npm.
Playwright Config
To use Mocha and Mochawesome with Playwright, you will need to set up Playwright to run Mocha tests. Here is how to enable the use of Mocha with Playwright in your playwright.config.ts file:
Command Line Usage
Now that you installed Mocha and Mochawesome, you can run Mocha tests using the Mochawesome reporter using the following commands:
Overview of executed test in Mocha + Mochawesome report

4. Monocart Reporter
Monocart reporter is a third-party playwright test reporter that converts raw test results into a single-page, interactive html file.
Its tree-grid layout, high performance data processing, and optional code-coverage merge - makes it a lean, high-power alternative to html reporter (which is built-in), or heavier suites like allure.
Installation
Playwright Config
Command-line usage
Overview of Monocart report
.webp)
Using Multiple Reporters
One advantage of using multiple reporters is one test run could provide multiple output formats at once.
By placing each reporter into the reporter array, you can stream the live "list" view to your terminal, save an html browsable dashboard, and export JUnit xml for ci integration in a single run.
You can use different reporters at once by providing them in an array:
Custom Reporter Options
HTML Reporter Options
JSON Reporter Options
JUnit Reporter Options
Setting up Effective Playwright Test Reports
Setting up test reports starts with correct setup and reporter selection.
Configuring your playwright.config.js file
The playwright.config.js file is where you set your test reporting options:
The above setting enables the HTML file to only take screenshots and traces only when tests fail, saving storage and giving you all the details of debugging.
Selecting the Right Reporter for Your Needs
Choosing the right playwright reporter depends on your particular needs:
HTML Reporter: for deep visual analysis and sharing with team members.
JSON Report: for data processing and linking to custom dashboards.
JUnit Reporter: for CI/CD integration, especially with systems that already use JUnit XML.
List/Line/Dot Reporters: for command-line execution and immediate feedback.
Many teams use multiple reporters at the same time to serve different purposes. Use the HTML reporter for human analysis and the JSON report for data processing.

Analysing Test Results Effectively
Having reports set up is just a start. The real value is in the analysis.
Interpreting Pass/Fail Metrics
Pass/fail rates are a quick health check, but deeper analysis gives more value.
- Failure trends: Are specific types of tests experiencing more failures?
- Stability trends: Are the rates of successful tests improving or declining?
- Component reliability: Which application components experienced the most failures?
Development teams should look for more than raw numbers to determine what the metrics mean regarding application quality.
Using the HTML Report Interface Efficiently

The HTML reporter has many features to help you evaluate:
- Filter: Focus on specific test statuses, durations, or projects.
- Search: browse for tests by name or content.
- Metadata View: Examines test annotations and tags.
- Error Grouping: Identifies trends in failures.
- Trace viewer: Step through execution with screenshots.
The Trace viewer is a debugging tool available in Playwright that provides a visual representation of your tests. It allows you to replay a test and step through it like a video.
Not only does the Trace Viewer allow you to replay your test step-by-step, it provides full context - DOM snapshots, network requests, console logs, and more.
We have published a blog post that will provide you a complete guide on how to use Playwright Trace Viewer as a faster way to debug! Go check it out!
{{cta-image-second}}
Transforming Raw Data Into Actionable Insights
The ultimate goal of reporting test results is to improve both the testing process and the application.
Recognizing Patterns Across Test Results
Pattern recognition is key to getting insights from playwright test results.
- Temporal patterns: Issues that happen at certain times (e.g. after deployments)
- Environmental patterns: Failures limited to specific browsers or devices
- Feature-specific patterns: Tests fails when specific features interact
- Data-dependent patterns: Failures due to specific data conditions
Tools like the JSON reporter allow you to programmatically detect these patterns.
Prioritizing Issues Based on Impact
Not all test defaults are equal. Teams should prioritize:
- User impact: How many users will be affected?
- Functionality criticality: Is this a core feature or an edge case?
- Frequency: How often does this happen?
- Complexity: How hard will it be to fix?
When you combine playwright test reports with your analytics and tracking tools, it gives you all the required data to make these assessments.
Playwright Test Report Integration with CI/CD
Playwright testing and reporting in CI/CD pipelines make them more valuable by giving feedback.
[Code Change] → [Automated Testing] → [Report Generation] → [Analysis] → [Prioritization] → [Issue Resolution] → [Verification] → [Documentation]

The Future of Test Reporting with Playwright
The Playwright ecosystem is evolving and some exciting things are coming:
- Better visualization tools for easier analysis.
- AI-assisted pattern recognition that instantly finds issue root cause.
- Deeper integration with monitoring to link test results to production metrics.
- Better collaboration tools to share and debate test results
As testing evolves, the line between test reporting and overall quality of monitoring will disappear and you’ll get more playwright coverage insights.


.svg)


.webp)


.svg)